Hunting star-forming clumps in Euclid Hα maps
Star-forming clumps are luminous, compact (kpc-scale) regions of intense star formation embedded within gas-rich disks at cosmic noon (z ≈ 1–2). These structures can contribute up to ~50% of a galaxy's total star formation rate and are thought to play an important role in bulge assembly and internal galaxy evolution.
Using Hα emission-line maps rather than rest-frame UV images allows us to uncover clumps that would otherwise remain hidden, and to separate star-forming regions from contaminants such as AGN or mergers. Producing emission-line maps from Euclid NISP slitless spectroscopy effectively transforms a spectrometer into a photometer.
This project will confirm the detection of clumps, and hopefully help find outliers that may have been overlooked with the automated method.
Why star-forming clumps?
Galaxies at earlier cosmic times looked different from the smooth spirals around us today. Many were gas-rich and lumpy, forming their stars in a handful of giant clumps rather than evenly across a disk. These star-forming clumps can be a thousand times more massive than typical star-forming regions in the Milky Way, and together they can supply a large fraction of a galaxy's new stars. How clumps form, how long they live, and whether they spiral inwards and help build the central bulge are all open questions.
What you are looking at
The images come from ESA's Euclid space telescope. Besides taking pictures, Euclid records a spectrum for every object in its field of view. From those spectra we construct emission-line maps: images of a galaxy in the light of one spectral line only. The most important is Hα, emitted by gas that has been ionised by hot, young stars. Effectively, a Hα map shows where a galaxy is forming stars right now, not just where its stars already sit.
We have built such maps for about 1,300 star-forming galaxies at redshifts 0.3 to 1 in the COSMOS field, drawn from the Khostovan et al. catalogue of Hα emitters. For each galaxy you also get maps in the other lines that fall in Euclid's wavelength range (Hβ, [OIII], [SII], [SIII], the Paschen series and more), plus two photometric images (VIS and NISP-Y band) that show the starlight.
What the maps look like
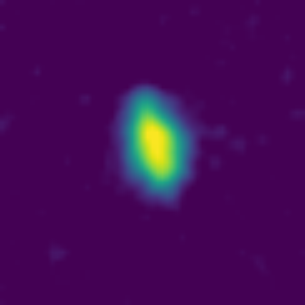
![The same galaxy shown in Hα, [SII], [SIII] 9069, [SIII] 9531 and the VIS starlight image — emission visible at the same position in each line map](about_multiline.png)
Why we need you
An automated algorithm has already searched the Hα maps for clumps, but the maps are noisy, and no algorithm perfectly separates real clumps from noise peaks and instrumental artifacts. Human eyes are still better at this.
Your marks are used in two ways. First, to check the automated catalogue: where several people independently circle the same spot, we can trust the detection; where nobody does, it was probably noise. Second, the marks become a training set for machine-learning clump finders, which need many examples of what people judge to be real. Along the way you may notice things no algorithm flags such as emission in unexpected lines, artifacts, mergers, oddities. Those are often the most interesting objects of all.
How to classify — a quick tutorial
Step 1 — Find the galaxy. Flip to the last two greyscale frames (VIS and NISP-Y) to see where the galaxy sits, then come back to the Hα frame. Real clumps sit on the galaxy, so knowing where it is makes everything easier. The VIS blend slider fades the starlight image in underneath the Hα map if you want to see both at once.
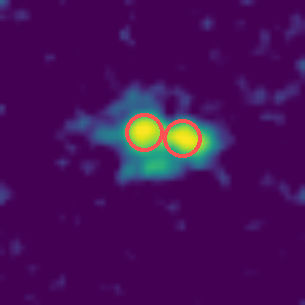
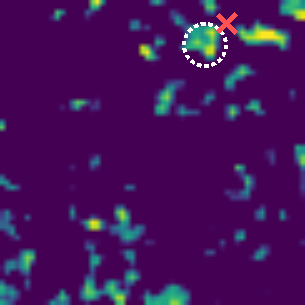
Step 2 — Circle every clump. A clump is a compact bright knot that sits on the galaxy and stands out from its surroundings. Press on the centre of a knot and drag outward until the circle wraps around it. Drag a circle to move it, drag its rim to resize it, and tap it and press ✕ to delete it. You can draw circles on any emission-line frame, not only Hα — every circle records which map it was drawn on. This is also how you tell us which lines the galaxy shows emission in: if the same clump is visible in Hα, [SII] and [SIII], circle it in all three maps and the galaxy is registered as emitting in all three lines.
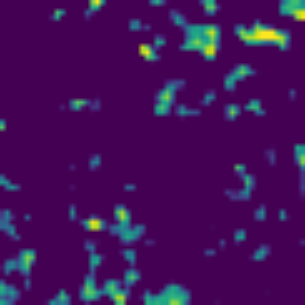
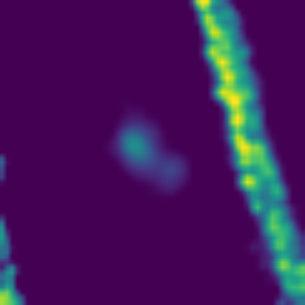
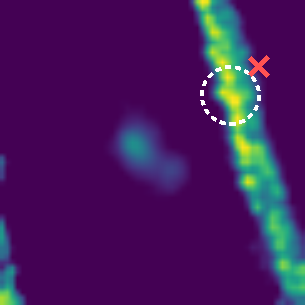
Step 3 — Know what not to circle. Isolated bright specks scattered far from the galaxy are noise. Long diagonal streaks are contamination from the spectra of other objects in the field — an instrumental artifact, not emission.
Step 4 — Rate the Hα map. Pick clean, noisy-but-usable, artifact-contaminated, or unusable. There is no separate question about the other emission lines — your circles already carry that information, so make sure you have circled the clumps in every line map where you can see them.
Step 5 — Submit. If you see no clumps, that is a perfectly good answer — press Submit & next without drawing anything. If you are unsure, give it your best guess; several people see every image, so no single answer decides anything.
The contrast controls are yours. Faint clumps often appear when you lower the floor or raise the softness; hard stretches sharpen bright knots. The VIS blend slider fades the starlight image in under any emission-line frame, so you can check that a knot really sits on the galaxy. Adjusting these affects only your view, never the data.
Shortcuts
← → flip frames 1–4 map quality Backspace delete selected circle Enter submit
Frequently asked questions
Do I need any background in astronomy?
No. The section above shows you everything you need: what a clump looks like, what noise looks like, and how to tell an artifact from real emission. If you are unsure about a particular galaxy, give it your best guess; several people see every image, so no single answer decides anything.
What exactly am I looking at?
Each subject is one galaxy, shown as a stack of images you can flip through. The first frame is the Hα emission-line map, made from Euclid spectroscopy, and it shows the light of glowing hydrogen gas around young stars. The following frames are maps in other spectral lines, and the last two greyscale frames are photometric images (VIS and NISP-Y) showing the galaxy.
What if I don't see any clumps?
That is a perfectly good answer. Press Submit & next without drawing anything — knowing that a galaxy has no visible clumps is just as useful to us as marking ten of them.
Why do the images look so grainy?
The emission-line maps are built from slitless spectroscopy of faint galaxies, so they are inherently noisy. Isolated bright specks scattered around the frame are noise; real clumps sit on the galaxy and stand out from their surroundings.
What are the long diagonal streaks?
Contamination from the spectra of other objects in the field — an instrumental artifact, not emission. If one crosses a map, pick "Artifact present" in the quality question.
How do I report emission in lines other than Hα?
By circling. Each circle records which map it was drawn on, so circling a clump in the Hα, [SII] and [SIII] maps registers the galaxy as showing emission in all three lines — there is no separate checklist. If a line map clearly shows the galaxy's emission, circle it there even when it is the same clump you already circled in Hα; that is how it gets counted.
How many people look at each galaxy?
Five, for now. A galaxy is retired once it has been classified five times, and we compare all five answers when we build the final catalogue.
What happens with my classifications?
They are used to verify an automatically produced clump catalogue and to train machine-learning models to find clumps in Hα maps. The results will feed into a scientific publication on star-forming clumps in Euclid galaxies; volunteers' contributions will be acknowledged.
This project is run by Andrea Henderson de la Fuente and Louis Gabarra (University of Oxford) with the Euclid Consortium.
1 · Circle every clump (drag on the image — in every line map where you see one)
2 · How is the Hα map?
Notes (optional, seen only by the research team)
Discussion
What do the columns and downloads mean?
| Galaxy | Hα | Class. | Circles (med) | Quality consensus | Disagreement | Lines |
|---|
Inspect
Discussion
Discussion
SortEvery comment left on a galaxy ends up here. Click a galaxy to open it in Results, reply to start a thread, and use ▲ to upvote comments worth seeing.